


Work with a spreadsheet interface
Enter data directly or import data from other programs
You can type data directly into the spreadsheet, much as you would with any spreadsheet-based program. Or, if you are currently using another program for meta-analysis, you can either copy data directly from that program or import it using a Wizard.

What if I have multiple subgroups or outcomes within studies?
The program allows you to work with studies that report data for more than one subgroup, outcome, time-point, or comparison. The program makes it easy to enter data for these studies, and offers a number of options for working with them in the analysis.

Compute the treatment effect (or effect size) automatically
In every meta-analysis you start with the published summary data for each study and compute the treatment effect (or effect size). For example, if a study reports the number of events in each group, you might compute the odds ratio. Or, if a study reports means and standard deviations, you might compute the standardized mean difference. This process of computing effect sizes is typically tedious and time-consuming. In some cases, especially when studies present data in different formats, the process is also difficult and prone to error.
With CMA the process is fast and accurate
With CMA you enter whatever summary data was reported in the published study, and the program computes the effect size from that summary data. For example, you could enter events and sample size, and the program would compute the odds ratio. Or, you could enter means and standard deviations, and the program would compute the standardized mean difference. Three examples (selected from more than a hundred options) are shown here.


What if my data is in some other format?
What if your studies reported data in some other format? Perhaps you have studies that reported only a p-value and sample size. Or, you have studies that reported an odds ratio and confidence limits. With any other program you would need to compute the effect size and variance for each study before proceeding to the analysis. By contrast, CMA allows you to enter almost any kind of data – it includes 100 formats for data entry similar to the three shown above. Simply locate your data type in a list and CMA will create the corresponding columns in the spreadsheet.

What formula is the program using to compute these effects?
To see the formula used to compute an effect size, double-click on that effect size. The program opens a dialog box that shows the exact formula used and also all details of the computation for that specific row.

What if I want to use another index of treatment effect?
In one of the examples shown above we entered events and sample size and the program computed the odds ratio. What if you would prefer to work with the risk ratio? Or what if you wanted to compute the standardized mean difference corresponding to the odds ratio? In another example we entered means and standard deviations and the program computed the standardized mean difference. What if you would prefer to work with the raw mean difference, or to compute the correlation corresponding to the standardized mean difference?
CMA allows you to work with the index of your choice, and to switch back and forth among indices.
For example, if you have entered the events and sample size, the program will compute the odds ratio, log odds ratio, risk ratio, log risk ratio, risk difference, standardized mean difference (d), bias-corrected standardized mean difference (g), correlation, and Fisher’s z. Or, if you enter means and standard deviations the program will compute the raw mean difference, standardized mean difference (d), bias-corrected standardized mean difference (g), correlation, Fisher’s z, log odds ratio, and odds ratio.
These examples are a subset of the supported formats and indices.

What if different studies reported different kinds of data?
Above, we showed that you can customize the data-entry screen to accept almost any kind of data. But what different studies provide different kinds of data? For example, what if one study reported events and sample size while another reported the odds ratio and confidence interval? How would you get both kinds of data into the program?
CMA allows you to mix and match the different data formats. You can enter events and sample size for the first few studies, then odds ratio and confidence interval for the next few studies, log odds ratios with variances for others, and so on. Or, you can enter means and standard deviations for some studies, p-values for other studies, t-values for others, and so on. You can customize the spreadsheet with as many kinds of data formats as you like. The program will compute the effect size from each of them and (to the extent possible) allow you to include them all in the same analysis. CMA is the only program to offer this feature.

What if some (or all) of my studies include pre-post or crossover designs?
CMA includes templates for more than 20 pre-post or crossover designs, which is of particular import since the standard error for these may be difficult to compute otherwise. And, you can mix and match these studies with studies that used post-tests alone.

For more detail on the computational options for paired studies download the whitepaper.
What if I have already computed the effect size?
If you have already computed the effect size and its variance (or standard error) you may enter these directly (the same as you would enter data in any other format).

Can I mix binary, continuous, and correlational data?
As explained above, the program allows you to enter summary data in more than one format – for example, events and sample size for one study and odds ratios with confidence intervals for another. But in this example both studies used binary data. What if some studies report binary data (events and sample size) while others report continuous data (means and standard deviations) or correlational data?
The program is able to convert across these different classes of data. It will convert among odds ratios, standardized mean difference, and correlations so that all may be used in the same analysis. A whitepaper gives details on these algorithms.
What if I have studies that look at point estimates rather than effect sizes or treatment effects?
While most meta-analyses work with effect sizes (which assess the relationship between two variables) some are used to estimate a risk, rate, or mean in one group (for example, “What is the risk of Lyme disease?”). CMA will work with these effects (or point estimates) as well.

Can I run a meta-analysis on regression weights?
Yes. In addition to being able to work with recognized effects (such as odds ratios and mean differences) the program is able to work with generic point estimates which may be analyzed either in their original scale or on a log scale.
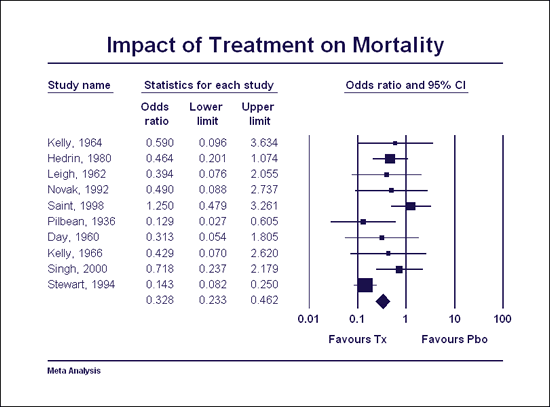
Perform the meta-analysis quickly and accurately
One click runs the core meta-analysis and creates a display that serves as a roadmap for all that follows.
This display is an interactive forest plot that yields a clear sense of the data - How many studies are included in the analysis, the precision for each study, whether the effect is consistent from study to study or varies substantially across studies, and so on. You can then customize this display as needed. Add or remove columns, set computational options, open tables with additional statistics. Some examples follow.

Display study weights
With one click you can include a column that shows the relative weight assigned to each study. With this mechanism, it becomes clear if the combined effect is a function of many studies, or if it was driven primarily by a small subset of the studies.

Select the computational model
Click on a tab to select the fixed effect model or the random effects model. You can also display the two simultaneously, which makes it possible to see how the point estimate and confidence interval differ between the two models.

Understand how the computational model affects the study weights
The program will also display the relative weights for a fixed effect analysis and a random effects analysis side-by-side. This helps to explain why the combined effect shifts as we move from fixed effect to a random effects model (See white paper).

Customize the analysis screen
You have full control over the statistics displayed for each study. You can display basic statistics, such as the effect size, standard error, and confidence limits. You can display counts, such as events and sample size for each group. You can display diagnostics for each study, such as the residual (the distance from the study to the combined effect).

Select the index of effect size
The tool bar includes a drop-down box that lists all available indices for the treatment effect (or effect size). When you select an effect size such as the odds ratio or standardized mean difference, all statistics, weights, and graphs, are updated automatically.

Display all details of the computations
All computations are displayed on a spreadsheet. You can view this spreadsheet and actually follow all details of the computation. If you are using your own spreadsheet for meta-analysis, you can compare this spreadsheet with your own. This also serves as a unique teaching tool.

Create high-resolution forest plots with a single click
A key element in any meta-analysis is the forest plot – a plot that shows the effect size and precision for each study and for the combined effect. This plot puts a face on the analysis – it shows whether the combined effect is based on a few studies or many, whether the effect size is consistent or varies, and so on. As such, the forest plot plays a central role in helping the researcher to understand the data, and also to convey the findings to others.
Most other meta-analysis programs use graphics engines that were developed for other purposes and push them into service for creating forest plots. By contrast, the plotting engine in CMA was developed specifically for the purpose of meta-analysis. It is very easy to use and provides a wide range of important options.
Create a high-resolution plot in one click and then customize any element on the plot. Select a symbol for studies, for subgroups, and for overall effect. Optionally, specify that symbols should be proportional in size to study weights, so the studies that contribute the most to the combined effect are easy to spot. Set colors and fonts for each element on the graph, and then export to Word™ or PowerPoint™ in a single click!
Export plots to PowerPoint
With one click you can open PowerPoint and insert a copy of the current slide. The whole process takes about 2 seconds.

Use cumulative meta-analysis to see how the evidence has shifted over time
A cumulative meta-analysis is actually a series of meta-analyses, where each analysis in the sequence incorporates one additional study. For example, the first row in the analysis might include a study published in 1990, the next row would include studies published in 1990 and 1991, and so on. A cumulative meta-analysis may be done retrospectively, to show how the body of evidence has shifted over time, or prospectively, with new studies being added to the body of evidence as they are completed.
While cumulative meta-analysis is most often used to track evidence over time, it can also be used to show how the evidence shifts as a function of other factors. For example, we could sort the data by study size and run a cumulative analysis. In this case the program would show the combined effect with only the largest studies included (toward the top) and how this effect shifted as smaller studies were added to the analysis. Similarly, we could start with the higher quality studies and see how the effect shifts as other studies are added.

Perform a sensitivity analysis
As part of a sensitivity analysis we might want to assess the impact of each study on the combined effect. For example, what was the impact on the combined effect of an outlier or of an especially large study? Or, did a small study have any impact at all?
To address these kinds of questions the program will automatically run the analysis with all studies except the first, then all studies except the second, and so on. The resulting plot shows the impact of each study at a glance.
Additionally, you have the option of running the analysis with any study or set of studies removed – these can be selected by name, or by the value of a moderator variable.

Assess the impact of moderator variables
When the effect size varies substantially from study to study an important goal of the meta-analysis could be to understand the reason for this variation.
Use analysis of variance to assess the impact of categorical moderators. For example, “Is the treatment more effective for acute patients than for chronic patients?” or “Is homework a more effective intervention than tutoring?”

Use meta-regression to assess the impact of continuous moderator variables. For example, “Does the treatment effect increase as a function of dosage?”, or “Is the magnitude of the effect size related to the age of the students?”

Work with multiple subgroups or outcomes within studies
The program allows you to enter data for more than one subgroup, outcome, time-point, or comparison within studies, and offers various options for dealing with these in the analysis.

Assess the potential impact of publication bias
Meta-analysis provides a mathematically accurate synthesis of available data, but there may be concern that significant studies were more likely to be published than non-significant studies, and therefore the pool of available data may be biased. The program includes a set of functions that can be used to assess the potential impact of this bias, as a kind of sensitivity analysis. For an extensive discussion of publication bias, download the whitepaper (Free Download) on this topic.

Work with subsets of the data
When running the analyses, you can select by (or filter by) any variable or combinations of variables. You could include or exclude studies by study name. You could include studies that had been rated “Yes” for “Double-blind”. You could include studies where the age had been coded as “Elderly” and the patient type as “Chronic.
